PostgreSQL Query Optimization: Techniques to Improve Query Performance

PostgreSQL query optimization is the process of identifying inefficient queries and improving how PostgreSQL retrieves, filters, joins, and processes data. The most effective approach is to measure performance, inspect the execution plan, make targeted changes, and benchmark the results.
In this guide, you’ll learn practical PostgreSQL query optimization techniques, how to use EXPLAIN ANALYZE, when to create indexes, how to improve query performance on large tables, and which PostgreSQL performance tuning tools can help you diagnose slow queries.
1. What Is PostgreSQL Query Optimization?
PostgreSQL query optimization involves improving SQL queries and their execution plans to reduce unnecessary processing, execution time, and resource consumption.
PostgreSQL uses a query planner to evaluate possible execution strategies and select a plan based on estimated costs. Depending on the query, table statistics, indexes, and available resources, it may choose a sequential scan, an index scan, different join methods, or parallel execution.
For example, consider a query that retrieves recent pending orders for a customer:
SELECT order_id, total_amount, created_at
FROM orders
WHERE customer_id = 105
  AND status = 'pending'
ORDER BY created_at DESC, order_id DESC
LIMIT 20;
This query might perform well on a small table but become slower as the number of orders grows. An appropriate index, accurate PostgreSQL statistics, and an efficient query execution plan can help PostgreSQL retrieve the required rows without processing unnecessary data.
However, PostgreSQL optimization is not simply about adding indexes. A slow query might result from inefficient filtering, expensive joins, stale statistics, excessive data access, lock contention, or a plan that does not suit the workload.
2. How to Identify and Analyze Slow PostgreSQL Queries
Before changing a query, establish where the time is being spent. Guessing at the cause can lead to unnecessary indexes or changes that make performance worse.
Use EXPLAIN to inspect the query plan
The EXPLAIN command shows the execution plan PostgreSQL expects to use.
EXPLAIN
SELECT order_id, total_amount
FROM orders
WHERE customer_id = 105;
The output can reveal whether PostgreSQL expects to use a sequential scan (Seq Scan) or an index scan (Index Scan), how many rows it estimates will be returned, and the estimated cost of each plan node.
These costs are planner estimates, not execution time measured in milliseconds.
Use EXPLAIN ANALYZE to measure actual performance
For a more detailed investigation, use:
EXPLAIN (ANALYZE, BUFFERS)
SELECT order_id, total_amount
FROM orders
WHERE customer_id = 105;
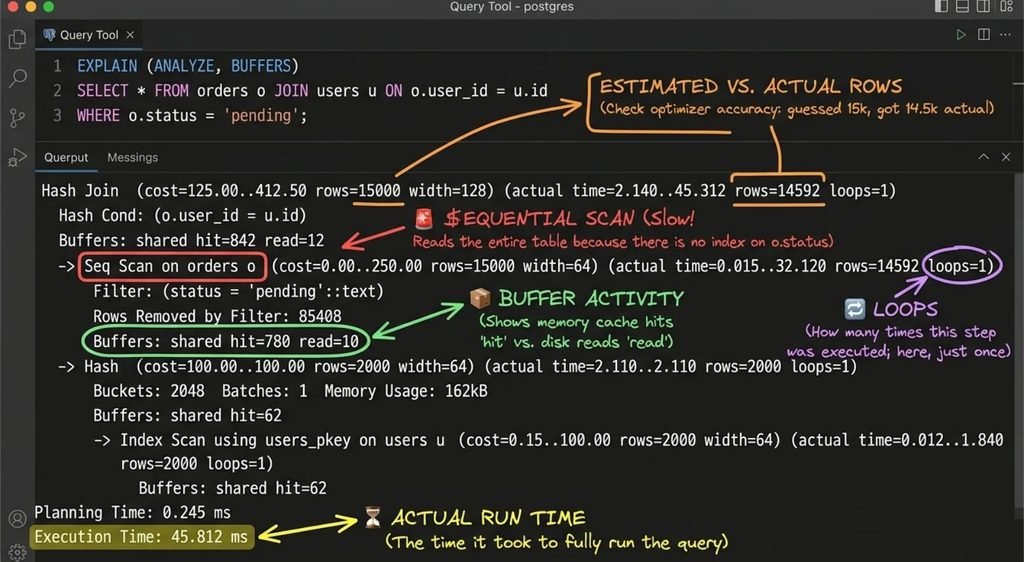
Unlike ordinary EXPLAIN, EXPLAIN ANALYZE executes the query and reports actual execution measurements. The BUFFERS option also provides information about PostgreSQL’s buffer activity.
Pay attention to these details:
| Plan detail | What it tells you |
|---|---|
| Estimated rows vs. actual rows | Whether the planner’s row estimates are accurate |
| Actual time | Time spent in plan nodes, reported in milliseconds |
| Loops | How many times a plan node executed |
| Seq Scan | PostgreSQL scans a table sequentially |
| Index Scan | PostgreSQL uses an index to locate matching rows |
| Shared hit/read buffers | Whether blocks were found in shared buffers or had to be read into them |
| Rows Removed by Filter | How many scanned rows failed a filter condition |
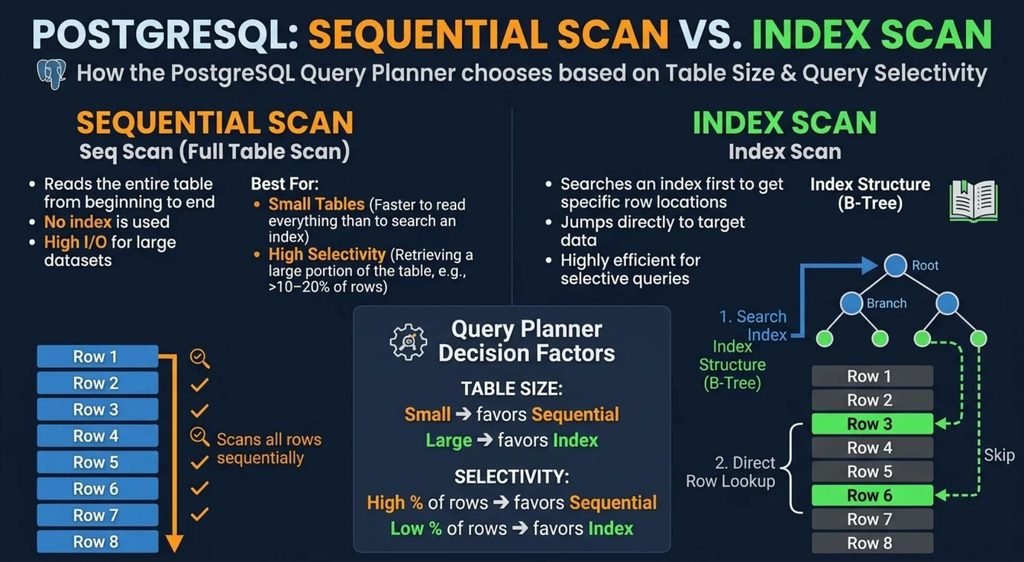
A sequential scan is not automatically a problem. It can be the most efficient strategy when a query needs a large proportion of a table. Similarly, an index scan can be inefficient if it requires many scattered table-row accesses.
Optimization tip: Compare estimated and actual row counts. Large differences can indicate inaccurate statistics or data distributions that the planner does not estimate well.
Important: EXPLAIN ANALYZE executes the statement. Use caution with UPDATE, DELETE, and other data-changing statements, particularly in production. Test them in a safe environment or use appropriate transaction safeguards.
For more details, see the official PostgreSQL EXPLAIN documentation.
3. How to Use EXPLAIN ANALYZE to Find Query Bottlenecks
An execution plan is most useful when you interpret it in the context of the query and its data.
Start with expensive operations and investigate repeated work, but remember that plan-node costs and times should not simply be added together. Parent nodes include work performed by their children, and actual times can reflect repeated execution.
Check sequential scans and index scans
A Seq Scan reads table rows sequentially and applies the relevant filters. This can be efficient for small tables or queries returning many rows.
If a query repeatedly scans a large table to return only a few rows, investigate whether an appropriate index could help. On the other hand, if the query needs most of the table, a sequential scan may be faster than accessing rows through an index.
Investigate inaccurate row estimates
Suppose PostgreSQL estimates that a query will return 10 rows but actually returns 10,000. The planner might choose a join strategy or scan method based on an incorrect estimate.
Refresh statistics when appropriate:
ANALYZE orders;The ANALYZE command collects PostgreSQL statistics that help the planner estimate how many rows different conditions will match. For correlated columns or complex data distributions, extended statistics may also help.
Examine buffer activity
With EXPLAIN (ANALYZE, BUFFERS), inspect shared buffer hits and buffer reads. A buffer read means the required block was not already available in PostgreSQL’s shared buffers and had to be read into them. It does not necessarily mean the storage device itself had to perform a physical read, because the operating system may cache the data.
Use these measurements to investigate excessive scanning, repeated lookups, and data-access costs rather than assuming that one metric explains the entire bottleneck.
For official guidance, consult PostgreSQL Performance Tips.
4. PostgreSQL Query Optimization Techniques
The best PostgreSQL query optimization techniques reduce unnecessary work while preserving the query’s intended results.
Optimize WHERE clauses and filtering
Apply selective filters as early as practical, and ensure the query uses data types and expressions compatible with relevant indexes.
For example:
SELECT order_id, total_amount
FROM orders
WHERE customer_id = 105
  AND status = 'pending';
Avoid wrapping indexed columns in functions when doing so prevents the intended index from being used. If filtering by a transformed value is a frequent requirement, an expression index may be appropriate.
For example, a case-insensitive lookup could potentially benefit from an index on lower(email) if the query uses the same expression. Confirm the behavior with the execution plan.
Improve joins and subqueries
Queries involving multiple tables can become expensive when join conditions are missing, row counts are underestimated, or intermediate results become unnecessarily large.
Make sure joins use the intended keys and investigate indexes for frequently used join and filter conditions.
SELECT o.order_id, c.customer_id
FROM orders AS o
JOIN customers AS c
  ON c.customer_id = o.customer_id
WHERE o.status = 'pending';
Do not rewrite every subquery as a join or every join as a subquery. PostgreSQL can optimize many SQL constructs, and the faster form depends on the query plan, table sizes, and data distribution.
Retrieve only the columns and rows you need
Avoid SELECT * when an application requires only a few fields. Selecting unnecessary columns increases data transfer and may prevent an index-only scan.
Use LIMIT when you genuinely need only a limited result set:
SELECT order_id, created_at
FROM orders
WHERE customer_id = 105
ORDER BY created_at DESC, order_id DESC
LIMIT 20;
A LIMIT clause does not guarantee less work if PostgreSQL must still scan or sort a large number of rows before finding the requested results.
Optimize ORDER BY, GROUP BY, and aggregation
Sorting and aggregation can consume substantial CPU and memory, particularly when queries process large intermediate result sets.
Filter unnecessary rows before aggregation when the query’s logic allows it. Review the plan for expensive sorts, hash operations, and disk spills.
For frequent reports that calculate totals over large datasets, a materialized view may help by storing the results of an expensive query. The trade-off is that the results must be refreshed to reflect changes in the underlying data.
Use prepared statements appropriately
Prepared statements can reduce repeated parsing and planning overhead when an application executes similar queries many times.
However, prepared statements are not always faster for every workload. PostgreSQL may use generic or custom plans depending on the execution context, and a generic plan can perform poorly when parameter values have very different selectivity.
Measure performance under realistic application conditions before changing how statements are prepared.
5. PostgreSQL Index Optimization Best Practices
PostgreSQL index optimization can improve queries that repeatedly retrieve a subset of rows. The key is selecting indexes that match actual query patterns rather than indexing every column.
For a deeper introduction to indexing concepts, read S4Stack’s guide to indexing in DBMS.
Choose indexes based on query patterns
Consider the earlier orders query:
SELECT order_id, total_amount, created_at
FROM orders
WHERE customer_id = 105
  AND status = 'pending'
ORDER BY created_at DESC, order_id DESC
LIMIT 20;
One possible index is:
CREATE INDEX idx_orders_customer_status_created
ON orders (customer_id, status, created_at DESC, order_id DESC)
INCLUDE (total_amount);
This index may help PostgreSQL locate a customer’s pending orders and retrieve them in the required order. The included column may help an index-only scan, but that depends on the query, visibility-map state, and the planner’s cost estimates.
Whether this is the best index depends on the table’s data distribution, other queries, index size, and write workload. Test before keeping it.
Understand different index types
| Index type | Common use case |
|---|---|
| B-tree | Equality comparisons, ranges, and many sorting operations |
| GIN | Supported data types and operators, including many JSONB and full-text search queries |
| Partial index | Queries that repeatedly target a specific subset of rows |
| Expression index | Queries that filter or sort using a particular expression |
| Covering index using INCLUDE | May support index-only scans when the query and visibility conditions permit |
For example, a partial index may be useful if pending orders represent a small portion of the table:
CREATE INDEX idx_pending_orders_customer
ON orders (customer_id, created_at DESC, order_id DESC)
WHERE status = 'pending';
PostgreSQL can use this index when the query predicate is compatible with the index predicate.
Avoid unnecessary indexes
Indexes consume storage and add overhead to inserts, updates, and deletes. Too many overlapping indexes can increase maintenance costs without improving important queries.
Review existing indexes, query plans, and workload statistics before creating new ones. After an index change, compare query latency and write performance under representative conditions.
For index types and syntax, consult the official PostgreSQL Indexes documentation.
6. Improve PostgreSQL Query Performance on Large Tables
Large tables require more attention to data distribution, query selectivity, statistics, and resource usage. A query that works well on thousands of rows may behave differently when a table contains millions of records.
Keep statistics current
PostgreSQL relies on statistics to estimate row counts and select execution plans. Run ANALYZE when appropriate, and investigate whether autovacuum and automatic analysis are keeping up with the workload.
Frequent bulk loads or substantial data changes can make statistics less representative of the current data.
Use pagination that fits the workload
Offset pagination is straightforward:
SELECT order_id, created_at
FROM orders
ORDER BY created_at DESC, order_id DESC
LIMIT 20 OFFSET 10000;
However, PostgreSQL may need to process and discard many rows before returning the requested page.
For deep pagination, keyset pagination can be more efficient when supported by a suitable index and stable ordering:
SELECT order_id, created_at
FROM orders
WHERE (created_at, order_id) <
      (TIMESTAMPTZ '2026-10-01 12:00:00+00', 5000)
ORDER BY created_at DESC, order_id DESC
LIMIT 20;
This example assumes descending ordering and that the cursor values come from the last row of the previous page. In a real application, use the actual cursor values and account for the required ordering and data consistency.
Consider partitioning for suitable workloads
Database partitioning divides a logical table into smaller physical partitions. It can help when queries filter on the partition key and PostgreSQL can eliminate irrelevant partitions through partition pruning.
Partitioning is not a universal speed improvement. It introduces design and maintenance considerations, and it will not automatically optimize unrelated queries.
If you’re exploring ways to distribute data as an application grows, read S4Stack’s guide to database sharding. Partitioning and sharding are different approaches: partitioning organizes a table within PostgreSQL, while sharding distributes data across separate database instances or nodes.
Review memory, vacuuming, and parallel execution
Configuration settings such as work_mem can affect sorts and hash operations. Increasing memory settings indiscriminately can create excessive memory consumption when many operations or connections run concurrently.
Likewise, parallel query execution can improve some large operations but may add overhead to smaller queries. Review the execution plan, workload, and resource limits before changing parallel-worker settings.
Keep routine maintenance healthy, including vacuuming and autovacuum, to help manage dead tuples and maintain useful statistics. Choose configuration changes based on measurements rather than copying generic tuning values.
7. PostgreSQL Performance Tuning and Monitoring Tools
PostgreSQL monitoring tools help identify slow queries, observe workload patterns, and detect performance regressions. Different tools serve different purposes, so the best choice depends on whether you need query-level diagnostics, historical monitoring, or configuration guidance.
| Tool | Primary use |
|---|---|
| EXPLAIN and EXPLAIN ANALYZE | Inspect query plans and measure execution behavior |
pg_stat_statements | Track planning and execution statistics for similar statements |
auto_explain | Log execution plans for queries meeting configured conditions |
| pganalyze | Query performance monitoring and PostgreSQL diagnostics |
| pgTune | Generate suggested configuration settings based on database and system inputs |
Start with built-in monitoring
The pg_stat_statements extension can help you identify statements with high total execution time, frequent calls, or significant average execution time. It must be installed and configured appropriately.
For example, after enabling the extension, you can inspect aggregated query statistics:
SELECT
    calls,
    total_exec_time,
    mean_exec_time,
    query
FROM pg_stat_statements
ORDER BY total_exec_time DESC
LIMIT 10;
The availability of columns depends on the PostgreSQL version and extension configuration. Access to query statistics may also require appropriate permissions.
Use these results to prioritize expensive queries, then inspect their execution plans with EXPLAIN ANALYZE in a suitable environment.
Third-party tools can provide historical query performance, visualizations, alerts, and tuning recommendations. Automated recommendations should still be reviewed against your application’s workload and tested before being applied.
8. PostgreSQL Query Optimization Best Practices and Common Mistakes
A reliable PostgreSQL performance tuning process is iterative: measure, diagnose, change one important factor, and measure again.
Follow these PostgreSQL best practices:
- Benchmark before and after changes. Compare execution time, buffer activity, and resource consumption using representative data and workload conditions.
- Check statistics before forcing a plan. Incorrect row estimates may explain why PostgreSQL chooses an inefficient strategy.
- Create indexes for real query patterns. Consider filtering, join conditions, sorting, and write overhead together.
- Monitor slow queries over time. A query can become slower after data growth, a deployment, a statistics change, or a different workload.
- Test with realistic data volumes. Small development datasets may hide expensive scans and sorts.
- Avoid arbitrary configuration changes. Increasing memory, parallelism, or connection counts without measuring the impact can create new bottlenecks.
- Recheck after schema and application changes. A previously useful index or query plan may no longer suit the workload.
The most common mistake is optimizing based on assumptions. A query that looks complicated is not necessarily the slowest query, and a sequential scan is not necessarily inefficient. Use measurements to identify the real bottleneck and validate each change.
9. Frequently Asked Questions
How do you identify slow queries in PostgreSQL?
Use pg_stat_statements to find queries with high execution time or frequent calls, then inspect important queries with EXPLAIN (ANALYZE, BUFFERS). Also investigate application latency, locks, and resource usage when query execution time alone does not explain the delay.
How does EXPLAIN ANALYZE help optimize PostgreSQL queries?
EXPLAIN ANALYZE executes a query and reports actual execution measurements alongside the plan. Comparing actual rows with estimates and reviewing scan methods, loops, and buffer activity helps identify inefficient operations.
How can you improve PostgreSQL query performance?
Start by measuring slow queries, then review execution plans, filters, joins, indexes, and statistics. Make targeted changes and benchmark them against the original query before deploying them.
How do you find long-running queries in PostgreSQL?
The pg_stat_activity system view shows current database activity, including query start times and states. For example:
SELECT
    pid,
    now() - query_start AS duration,
    state,
    query
FROM pg_stat_activity
WHERE state = 'active'
  AND query_start IS NOT NULL
ORDER BY duration DESC;
Use appropriate permissions and avoid exposing sensitive query text in shared logs or dashboards.
Why might a PostgreSQL query suddenly become slow?
Possible causes include changes in data volume or distribution, stale statistics, a different execution plan, increased contention, cache changes, or resource pressure. Compare recent execution plans and monitoring data to isolate what changed.
What is the best PostgreSQL query optimization tool?
There is no single best tool for every situation. Start with PostgreSQL’s built-in EXPLAIN ANALYZE and pg_stat_statements; consider tools such as pganalyze when you need additional monitoring, historical analysis, or diagnostic features.
Conclusion
Effective PostgreSQL query optimization starts with evidence, not guesswork. Identify slow queries, inspect their execution plans, improve filtering and joins where necessary, choose indexes based on real workloads, and keep statistics and routine maintenance healthy.
For larger databases, pagination strategies, partitioning, memory configuration, and monitoring can also matter but only when they address an identified bottleneck. Measure each change before and after implementation to ensure it improves the workload that matters.
By following a consistent process of diagnosis, targeted optimization, and benchmarking, you can improve PostgreSQL query performance while avoiding unnecessary complexity and maintenance costs.